Shopify AOV- Average Order Value Calculation (Most Guides Get it Wrong!)

Sid B
April 9, 2026
Share article
Most Powerful Bundle Builder App
Summary
  • To calculate Shopify AOV correctly, use (Gross Sales − Discounts) ÷ Orders, not total revenue ÷ orders. Most guides teach the simplified formula, which can overstate your AOV by 20–65% if you run frequent discounts.
  • Find it in Shopify Admin: Analytics → Reports → "Average order value over time." Shopify applies the correct formula automatically, with no manual calculation needed.
  • The US Shopify average AOV is $85. Top 10% of stores exceed $311 per order. Bottom 20% sit below $54. Always benchmark against your specific industry, not the all-store average.
  • Heavy discounting mechanically deflates AOV. Shopify subtracts discount values before calculating. Compare AOV before, during, and after every promotion to measure true impact.
  • A healthy AOV covers your CAC on the first order. If it does not, you are relying entirely on repeat purchases to break even, which is only sustainable if your retention growth tactics playbook, see: How to Increase AOV on Shopify.

Most Shopify merchants are calculating their Shopify AOV = Average Order Value incorrectly. Not because of anything they set up incorrectly, but because the formula most guides teach and the formula Shopify actually runs are not the same thing. The difference is not small, and if you are using your AOV to set free shipping thresholds, upsell offers, or growth targets, you may be working from the wrong baseline. This guide covers the correct formula, how to pull your AOV directly from the Shopify dashboard, how to benchmark it against your industry, and what to do with the number once you have it.

How to Calculate Shopify AOV Average Order Value

If you have been tracking your AOV in Shopify, you may be working with a number that is off, and not by a small margin. The formula most guides teach is a simplified version of what Shopify actually calculates, and depending on how heavily you discount, the gap can be significant.

This guide walks you through the correct formula, how to pull your AOV directly from Shopify, what your number means for your store type and industry, and how to start growing it. For the full growth tactics playbook, see: How to Increase AOV on Shopify.

What Is Average Order Value on Shopify?

Average Order Value (AOV) is the mean revenue your Shopify store generates per transaction over a given time period. Put simply, it tells you how much a typical customer spends in a single order.

Why AOV Is a Growth Lever, Not a Vanity Metric

AOV is one of three inputs to revenue: traffic, conversion rate, and order value. Most marketing budget goes toward traffic. Most optimization effort goes toward conversion rate. AOV is frequently the most underinvested lever and often the most cost-efficient one. Getting a customer who has already committed to a purchase to spend more costs nothing in acquisition.

AOV vs. Total Revenue: Why They Tell Different Stories

 Revenue can grow while AOV falls. If a sitewide discount doubled your order volume this month, revenue looks strong but your AOV likely dropped. More orders at lower values and fewer orders at higher values can produce identical revenue totals while representing very different business health. AOV tells you whether you are growing the value of each transaction, or just adding volume.

Shopify AOV Calculation Formula

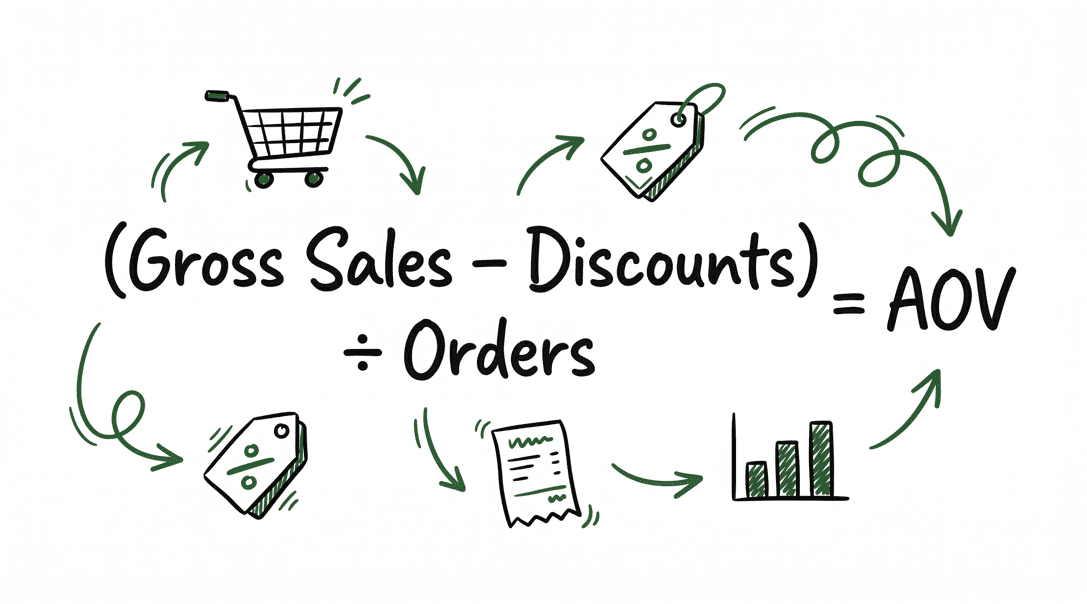
 Here is where most guides get it wrong. The Shopify-AOV-Average Order Value formula repeated across almost every blog is:

```html id="wf-table-shopify-formula"
Source Formula
Most guides Total Revenue ÷ Number of Orders
Shopify’s actual formula (Gross Sales − Discounts) ÷ Number of Orders
```

Shopify updated its AOV definition in January 2023 to reflect this. [1] What the platform explicitly excludes from its calculation:

  • Taxes
  • Shipping charges
  • Post-order adjustments (exchanges or edits made after the order was placed)
  • Returns processed after order creation

Working Example 

```html id="wf-table-aov-example"
Item Amount
Gross sales $1,200
Discounts applied $200
Taxes $96
Shipping $150
Number of orders 10
Method Calculation AOV
Most guides: total revenue ÷ orders $1,646 ÷ 10 $164.60
Shopify’s formula: (gross sales − discounts) ÷ orders $1,000 ÷ 10 $100.00
```

A $64.60 difference per order, a 64% overstatement of what customers are actually spending on your products. If you are setting upsell thresholds or free shipping minimums using the inflated number, you are optimizing off the wrong baseline.

Why This Matters Strategically

The heavier your discounting, the wider this gap becomes. Shopify retroactively applied this updated definition to all historical data in the admin when the change went live, so your full historical trend line reflects this formula throughout. [1]

How to Find Your Shopify AOV- Average Order Value: Step by Step

Shopify has a built-in AOV report that uses the correct formula automatically. No manual calculation needed when trying to access your Shopify AOV Average Order Value Calculation. [5]

Step 1: In Shopify Admin, go to Analytics → Reports.

Step 2: Open “Average order value over time.” This is the primary AOV report.

Step 3: Set your date range. Use the “Compare to” feature to benchmark against a prior period, such as this month vs. last month, or this quarter vs. the same quarter last year.

Step 4: Click “Group by” to choose your time unit: day, week, month, quarter, or year. Grouping by day of week or month of year helps surface patterns. Does AOV spike on weekends? Does it fall during promotional windows?

Step 5: Go to Analytics → Reports → Total sales over time to see order volume alongside total revenue. Cross-reference your Shopify AOV-Average Order Value and understand the transaction volume behind the average.

Step 6: On your main Analytics home page, add AOV as a metric card for at-a-glance monitoring alongside sessions, conversion rate, and revenue.

Key Reports for AOV Analysis

```html id="wf-table-shopify-reports"
Report What It Shows When to Use
Average order value over time AOV trend across any date range Primary tracking, before and after promotions
Total sales over time Orders and total revenue together Cross-checking AOV, understanding volume
Total sales breakdown Gross sales, discounts, net sales, taxes, shipping Diagnosing what is driving or dragging AOV
Total sales by order Each individual transaction by date Finding outlier orders that skew your average
Sales by customer name Order history per customer B2B account analysis, loyalty program insights
```

AOV Benchmarks by Industry (USA, 2026)

Before deciding whether your AOV needs work, benchmark your calculated Shopify AOV Average Order Value against the right category. Here are typical AOV ranges for US Shopify stores by industry: [6]

```html id="wf-table-industry-aov-range"
Industry Typical AOV Range
B2B / Wholesale $300 – $1,000+
Luxury & Jewelry $200 – $500+
Electronics & Tech $150 – $400
Home & Furniture $150 – $350
Sporting Goods & Outdoors $100 – $250
Apparel & Fashion $50 – $150
Health & Beauty $50 – $120
Pet Supplies $50 – $110
Food & Beverage $40 – $100
Toys & Games $40 – $90
Books & Media $20 – $60
```

The median AOV across all US Shopify stores is $85. Top 10% of stores exceed $311 per order. The bottom 20% sit below $54. [2]

How to Interpret These Numbers

  1. Industry position. Are you above or below your category range? Below it, focus on bundles, upsells, and free shipping thresholds. Above it, protect that advantage through product quality and customer experience. Do not discount your way to higher volume at the cost of a hard-earned AOV premium.
  2. AOV vs. margin. A $300 AOV with a 10% margin is less profitable than a $100 AOV with 60% margin. Always pair AOV with your cost of goods before drawing conclusions about which products or customer segments to prioritize.
  3. AOV vs. purchase frequency. In food, beauty, and supplement categories, a lower AOV is acceptable if customers reorder frequently. Lifetime value matters more than single-order size in high-repurchase verticals. A below-median AOV can be a deliberate and profitable trade-off when retention is strong.
  4. B2B vs. D2C. B2B stores almost always carry higher AOVs because buyers purchase in bulk or for business use. Never benchmark a wholesale or B2B store against D2C averages.

The CAC Rule of Thumb

A healthyShopify AOV- Average Order Value is one that covers your customer acquisition cost (CAC) and leaves room for profit on the first order. If your AOV does not cover your CAC, you are relying entirely on repeat purchases to break even. That works in high-retention verticals. In lower-retention categories, it is a fragile foundation to build on. [2]

Shopify AOV by Store Type: What to Track and Why

```html id="wf-table-store-type-aov"
Store Type What to Track Key Risk
General / multi-product AOV by product category and channel Blended average hides which lines drag overall value
Single-product / niche (skincare, supplements) AOV over time Bundles, subscriptions, and quantity breaks are the primary levers
Discount-heavy / promo stores AOV before, during, and after each campaign Discounting inflates order count while depressing AOV
B2B / wholesale AOV by customer or company Spot high-value account drop-off early
Multi-channel (online + POS + social) AOV segmented by channel Online and in-store customers often have very different spending patterns
```

5 Setup Checks Before You Trust Your AOV Data

  1. Analytics permissions enabled. Staff members need Analytics permissions activated in their Shopify role settings to access reports. If you are seeing limited or missing data, permissions are the first thing to check.
  2. Sales channels correctly tagged. If you sell across the online store, POS, and social commerce, make sure each channel is properly configured in Shopify. Without clean channel tagging, you cannot filter AOV by channel and are working with a blended number that may mask significant variance.
  3. Discounts set up through Shopify. All discount codes and automatic discounts must be created inside Shopify to be captured in the AOV formula. Promotions applied outside the platform, through CSV imports or manual price adjustments, may not appear correctly in reports.
  4. Order financial status accurate. AOV is most meaningful when calculated on paid, non-cancelled orders. If pending or cancelled orders are sitting in your system at scale, they will distort the average.
  5. The 48-hour data lag. Shopify sales data can take up to 48 hours to fully settle. Avoid making significant decisions based on data from the most recent day or two, especially in the immediate aftermath of a sale or campaign launch.

How to Read Your Shopify AOV: What the Numbers Are Telling You

```html id="wf-table-aov-patterns"
AOV Pattern What It Signals Where to Focus
Below your industry range Customers are not adding enough to each order Bundles, free shipping thresholds, post-purchase upsells
Inconsistent across time One channel or product segment is dragging the average Segment by channel and product, identify the source of variance
Falls during and after promotions Discounts are attracting lower-value buyers Redesign your thresholds: tie free gifts or free shipping to a value above your baseline AOV
Strong AOV, low order count Product-market fit is solid Acquisition is the constraint, not product value
```

How to Increase Your AOV on Shopify

Build Product Bundles

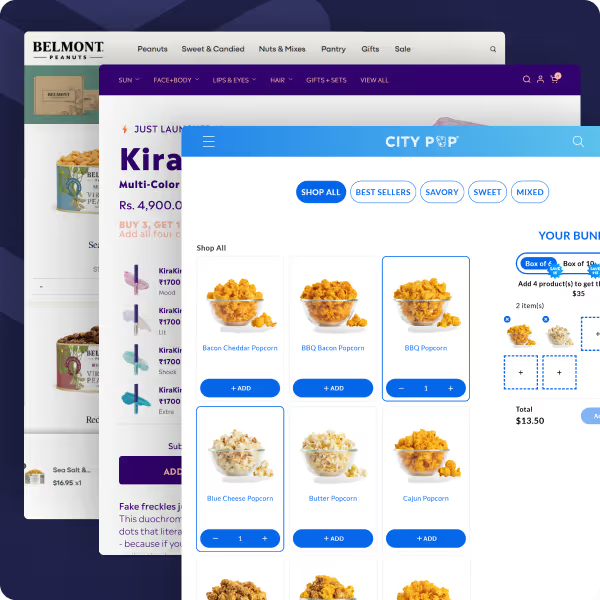
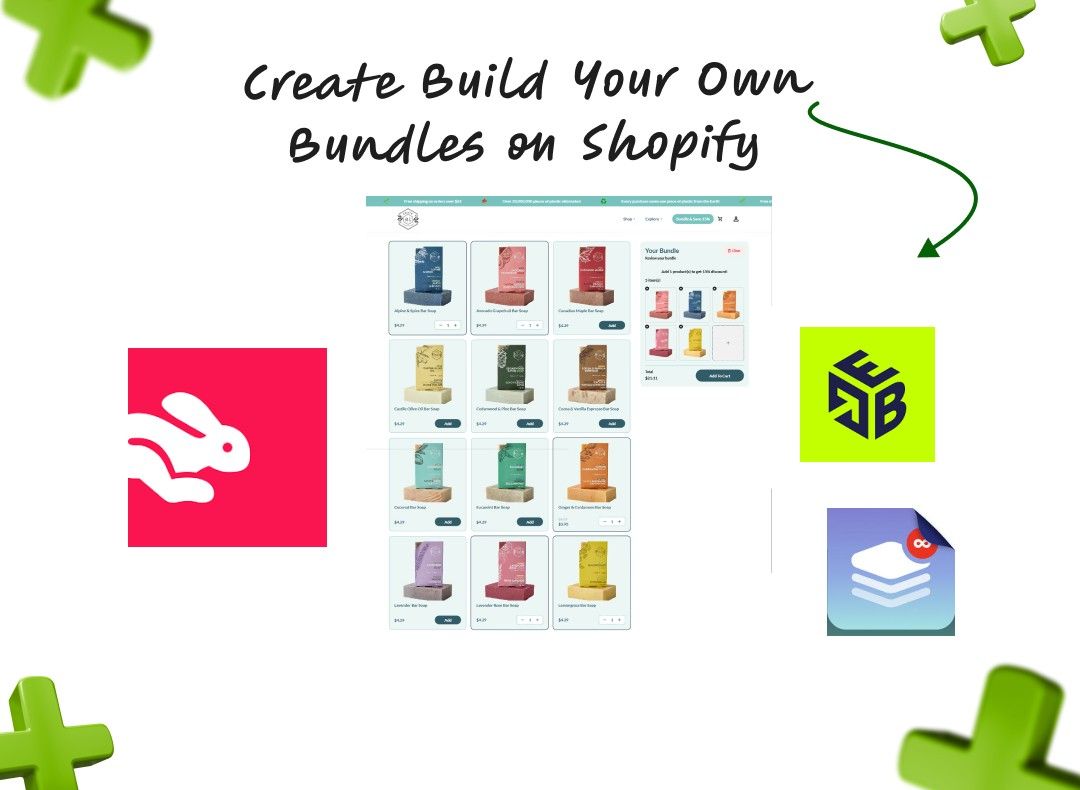
Bundles are the most reliable Shopify AOV (Average Order Value) driver in ecommerce. Instead of selling one product at a time, you group complementary products together at a slight discount. Customers spend more in one order, and your per-order revenue goes up without any extra acquisition cost.

With Easy Bundle Builder, Shopify merchants can create several bundle types depending on their product mix:

  • BYOB (Build Your Own Bundle): customers choose their own combination from a defined product range
  • Mix and Match: set the quantity, let customers choose the variants
  • Fixed bundles: curated sets at a set price, such as a Starter Kit or a Gift Box
  • Subscription bundles: recurring orders with bundled products, ideal for consumables and beauty

Merchants like Cove ($4.4M in bundle revenue), Evry Jewels ($465K), and Marin Skincare ($457K) have used Easy Bundle Builder to build bundle strategies that meaningfully lift AOV. You can see live examples in the Shopify Bundle Gallery.

Offer Volume Discounts and Quantity Breaks

“Buy 2, get 10% off. Buy 3, get 20% off.” This tactic works especially well for consumables, apparel basics, and anything customers naturally buy in multiples. See discounting strategies for a full breakdown.

Kite Discount and Free Gift lets you set up tiered volume discounts natively on Shopify. You can configure discount tiers by quantity, by spend amount, or by product collection, and customers see a clear discount table as they add more items to cart. No code required.

Fly Bundles is built for quantity breaks and pre-curated sets. It adds a quantity break table directly on the product page and supports cross-sell suggestions alongside the discount tiers to further increase basket size.

Recommend Kits and Pre-Curated Sets

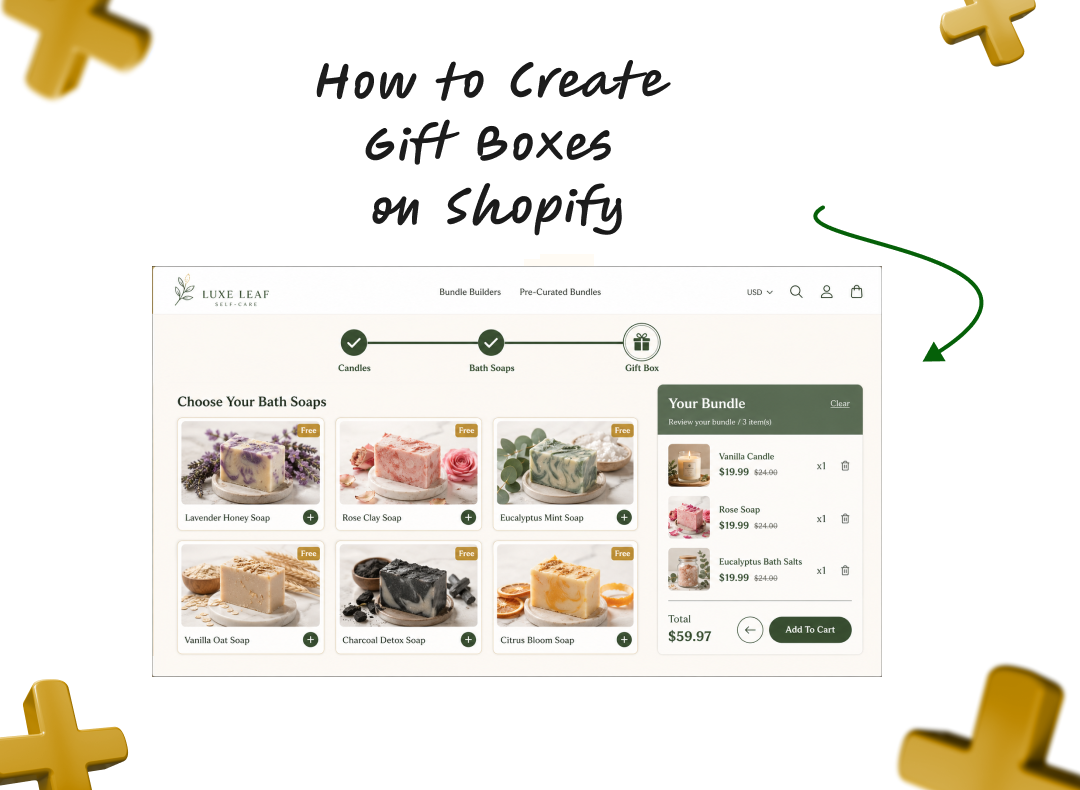
Kits work differently from DIY bundles. You curate the set for the customer, such as a Skincare Starter Kit, a New Pet Essentials Box, or a Coffee Lover’s Bundle, and present it as a single premium offering. Customers pay for the curation and convenience, which means your AOV goes up without requiring the customer to make a complex decision.

Fly Bundles supports pre-curated sets with infinite variants and inventory sync, so you do not need to create separate Shopify products for each kit configuration.

Run Free Gift Campaigns

“Spend $80, get a free gift.” Free gift campaigns drive customers toward a spend threshold without the margin hit of a straight discount. They protect margin better than a percentage-off promotion and create excitement around the purchase. See Skai Lama’s gifting strategies for more on how this works across different store types.

Kite Discount and Free Gift handles free gift campaigns natively on Shopify, including auto-adding the gift to cart when the threshold is met and a progress bar that shows customers exactly how close they are to qualifying. Merchants also use Kite Discount and Free Gift for BOGO offers and Buy X Get Y campaigns, all from the same dashboard.

Set Free Shipping Thresholds

Setting a free shipping minimum at roughly 30% above your current AOV is one of the lowest-friction Shopif AOV- Average Order Value tactics available. [4] It creates a visible incentive at the exact moment customers are already committed to buying, with no discount required. 

Upsell at Checkout

The checkout is the highest-intent moment in the buying journey. A customer who has already clicked “Buy” is the easiest person to sell one more item to. No new traffic needed and no new persuasion required. Learn more about Shopify checkout upsells and how merchants use them.

Checkout Wiz, built for Shopify Plus merchants, lets you add post-purchase upsell offers, trust badges, and cross-sell recommendations directly in the checkout flow using Shopify’s native Checkout Extensions. No custom code required.

For a full playbook on each of these tactics with setup examples, threshold recommendations, and category-specific benchmarks, see: How to Increase AOV on Shopify.

Common AOV Tracking Mistakes

  1. Mixing gross and net metrics across reports. Shopify’s reports use different definitions. “Total sales” in one report is not the same as “net sales” in another. Before cross-referencing numbers from multiple reports, confirm which metric each one uses.
  2. Not segmenting by channel. A blended $87 AOV can hide a $45 POS average and a $130 online store average. Segment before you act, or you will apply the wrong fix to the wrong channel.
  3. Acting on data less than 48 hours old. This is especially risky in the 24–48 hours after a campaign launch or sale event. Wait for data to settle before concluding whether a promotion helped or hurt your AOV.
  4. Confusing AOV with revenue per visitor (RPV). These are different metrics driven by different levers. RPV improves when conversion rate goes up. AOV improves when each buyer spends more. Improving conversion rate can actually lower AOV if the new converters are lower-intent buyers. Track both separately.
  5. Setting your baseline during a promotion. If you measure your benchmark AOV during BFCM or a major sale, every future period gets compared against an artificially skewed number. Set your baseline during a normal, non-promotional trading period.

No items found.

Rushy Scarcity Countdown Timer

Free to install
Built for Shopify

Hurrify customers to buy within a given timeframe with a sales countdown timer & improve conversions

Another popular Shopify checkout app is Checkout Promotions. The app comes with the ability to leverage a collection of highly robust visibility rules that help show customers one-click post purchase upsell promotions after an order payment has been made. Some of its key features include:

Features

AI recommended and manual recommendations for upselling.

Complete branding control.

Checkout Upsell for increasing AOV.

AI recommended and manual recommendations for upselling.

Pricing

Development

Free

Monthly Plan

$99/ month

Plus Plan

$99/ month

Plus Plan

$99/ month

FAQ On How To Calculate AOV On Shopify

Does Shopify AOV include taxes and shipping?
What is the correct AOV formula in Shopify?
Why did my AOV drop after running a discount?
What is a good AOV for a Shopify store?
How often should I check my AOV?
Can I calculate AOV by channel in Shopify?
Sid B

Sid B

Sid is the founder of Skai Lama and The Indian Dream Podcast. He is passionate about building SaaS and talks about eCommerce Growth, 0-1 Startups, Building Businesses and Brands, and Shopify.

Powerful Bundle Builders that Increase Your AOV

bfcm 2025 guide
Access Now