.svg)
.svg)

.svg)
.svg)


%20(1).jpg)
.jpg)
Our Apps Have Driven
5X AOV | 2X Conversions | $30M+ Additional Revenue
5X AOV | 2X Conversions | $30M+ Additional Revenue
.svg)


5.0 (3000+ Reviews)


Shopify Apps





.svg)

Easy Bundle Builder’s analytics gives you a clear view of how your bundles are performing. You can track revenue, orders, AOV, sessions, conversions, discounts, and customer behavior. Use these insights to spot drop-offs, improve bundle placement, compare bundle types, adjust offers, and encourage repeat purchases. This helps you understand what is working and where your bundles need improvement.
Creating a bundle on your Shopify store is only the first step. Once it is live, you need to know whether shoppers are finding it, engaging with it, and completing their purchases. You also need to understand which bundles, products within the bundles, discounts offered, and placements are driving the best results.
Easy Bundle Builder is a Shopify bundle app that helps merchants create product bundles and offer different discount options. Its built-in analytics dashboard gives you a clearer view of how those bundles perform, from traffic and revenue to conversion and repeat purchases. You can use these insights to identify what is working and decide what to improve next.
Analytics Dashboard
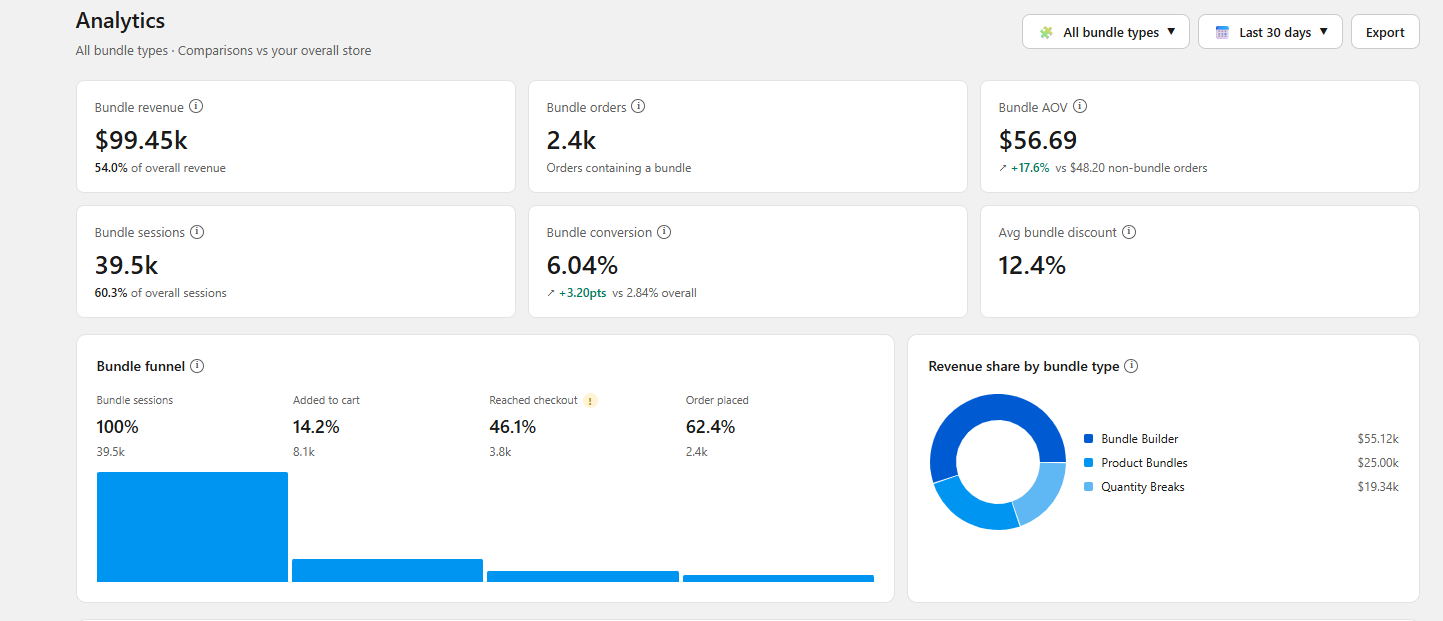
Easy Bundle Builder’s analytics puts your main bundle metrics in one place. You can compare sessions, orders, revenue, AOV, conversion, and customer behavior to understand how your bundles are performing.
Bundle revenue shows how much revenue your bundles generated during the selected period. You can also see how much of your store’s total revenue came from bundles. This gives you a quick idea of how much your bundles are contributing to overall sales.
Bundle orders show how many orders included at least one bundle during the selected period. You can also compare bundle orders with your store’s total order volume. This helps you understand how much of your store’s sales activity is coming from bundles.
Bundle AOV shows the average order value for orders containing bundles. Comparing this with your overall Shopify store AOV can tell you whether bundles are helping shoppers spend more. If the difference is smaller than expected, you can look at the products, pricing, and discounts used in the bundle.
Bundle sessions show how many store sessions involved a bundle. You can also see bundle sessions as a share of your total store sessions. This helps you understand how much traffic your bundle offers are receiving.
Placement performance shows how each upsell surface performs, from first impression to purchase. Compare Upsell Offer and Upsell Widget to track engagement, add-to-cart activity, orders, and revenue.
Upsell Offer is the card, button, or widget that opens or links to a bundle. Upsell Widget is the bundle builder embedded directly on a product page. For each surface, you can track:
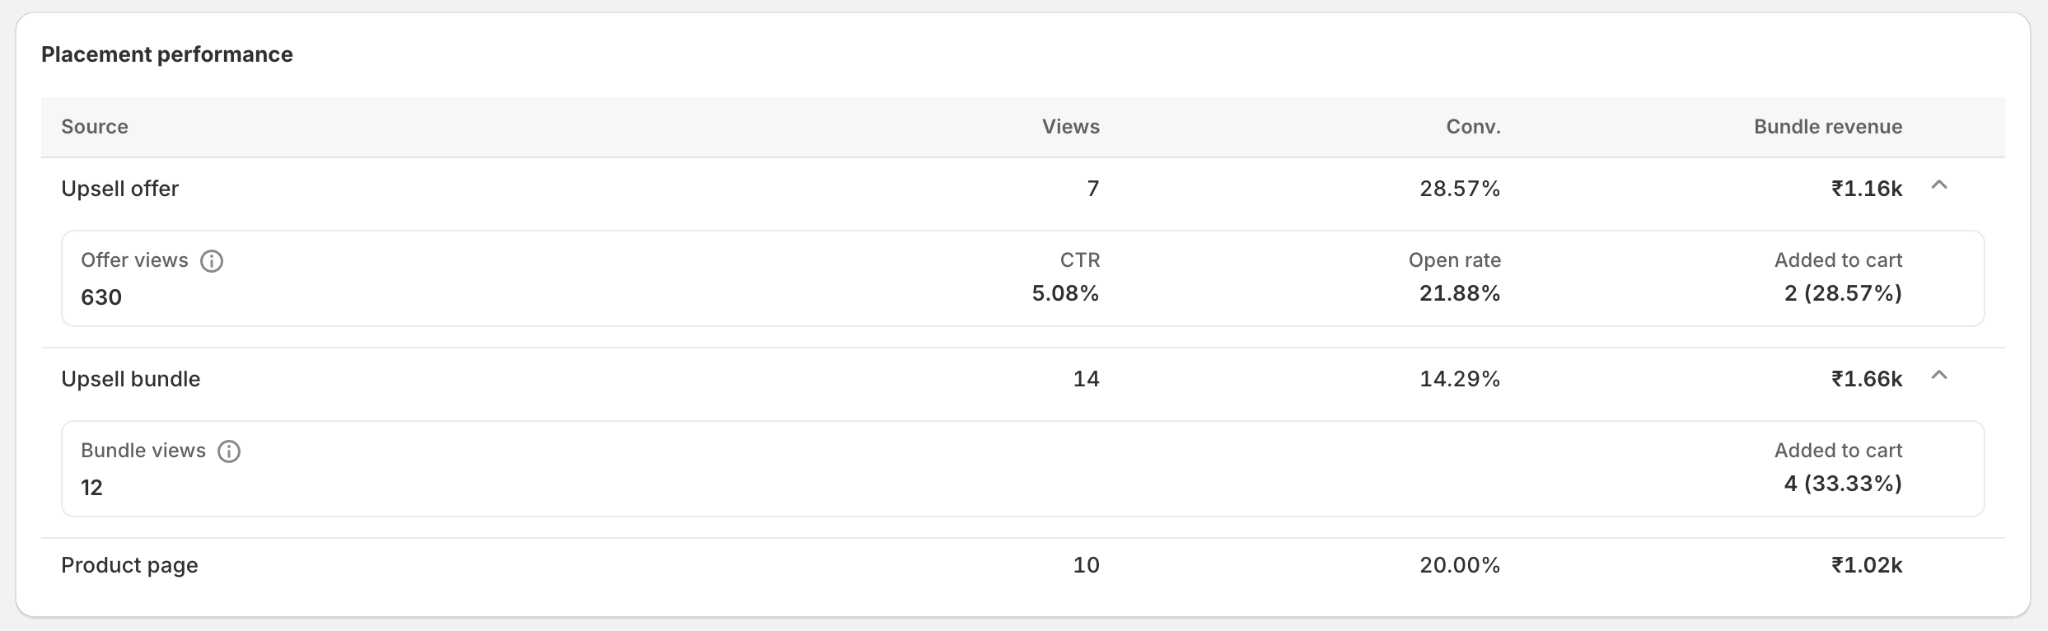
This gives you more than a traffic number. For example, an upsell may receive plenty of impressions but generate few clicks, while another may receive fewer views but drive more bundle revenue. Comparing these stages helps you understand which placements are actually contributing to sales.
Bundle conversion rate shows the percentage of bundle sessions that result in an order. Comparing it with your overall store conversion rate gives you a better idea of how effectively bundle traffic converts. If plenty of shoppers are reaching a bundle but few are buying, the offer may need a closer look.
Average bundle discount shows the average discount applied to bundle orders. You can compare it with revenue, orders, AOV, and conversion rate to see how discounts affect performance. This can help you find an offer that feels worthwhile to shoppers without giving away more margin than necessary.
The bundle funnel shows how shoppers move through the main stages of the purchase journey. These stages include sessions, add-to-cart, checkout, and completed orders. Looking at each stage can help you see exactly where shoppers are leaving.
Bundle share of order value shows how much of an individual order’s value comes from the bundle. This is different from revenue share by bundle, which compares the contribution of different bundles to total bundle revenue. A lower share can mean shoppers are adding the bundle alongside other products rather than making it the main part of their order.
Revenue share by bundle shows how your total bundle revenue is divided between individual bundles. It can quickly show you which bundles are bringing in the most revenue and which ones contribute less. This makes it easier to focus your attention on the offers that matter most to your store.
Product combination performance shows how different products perform when they are offered together. You may find that some combinations consistently get more orders while others struggle to generate interest. These patterns can help you understand which products naturally make sense together.
This metric shows how many products shoppers select on average when placing a bundle order. If shoppers usually select only a small number of products, it may be worth looking at whether the bundle gives them enough reason to add more. Comparing this across bundles can also show which offers encourage larger selections.
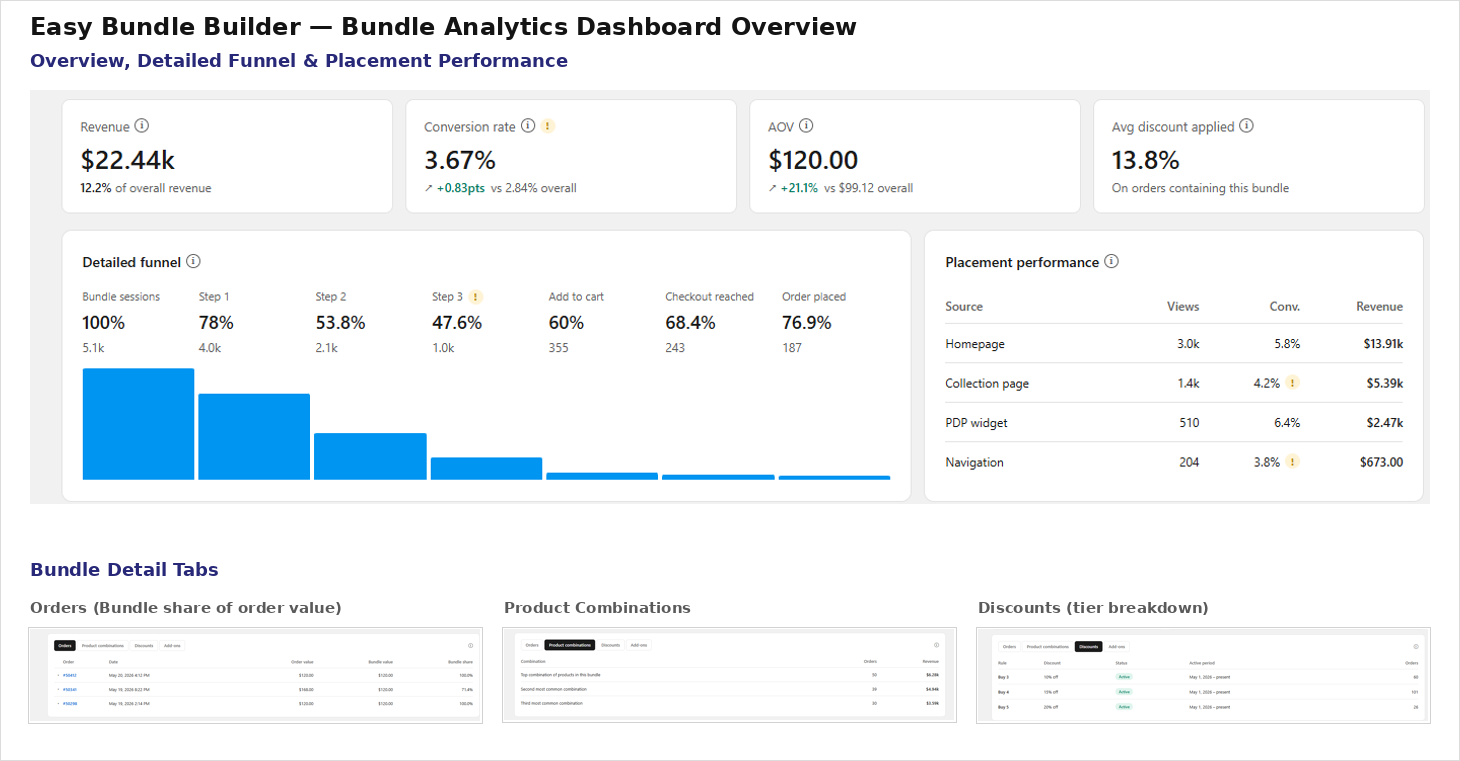
Individual bundle performance lets you look at important metrics for each bundle, such as views, orders, revenue, AOV, conversion rate, and trends. Comparing individual bundles makes it easier to spot your strongest offers. It can also help you catch when a previously strong bundle starts to lose momentum.
Bundle type performance lets you compare different bundle formats, such as Build Your Own Bundle (BYOB), Quantity Breaks, or other bundle types available in your store. Looking at revenue, orders, AOV, sessions, and conversion can show which formats are working better. You can then decide which types are worth promoting or testing further.
Bundle buyer mix shows the proportion of new and returning customers buying your bundles. Comparing this with your overall store data helps you understand who your bundle customers are. It can also show whether bundles are bringing in new shoppers or encouraging existing customers to purchase again.
Repeat bundle purchase rate shows the percentage of bundle buyers who have purchased a bundle before. This helps you understand whether customers are coming back for another bundle purchase. It is especially useful when your products are things customers regularly use or replace.
Customer LTV compares the lifetime value of bundle customers with your overall store customer LTV. It is more useful as a comparison than as a metric you directly optimize. If bundle customers have a higher LTV, you can look at repeat purchases and purchase frequency to understand why.
Bundle diagnostics helps you spot potential problems in your bundle performance. Rather than manually going through every metric, you can use the available data to identify areas that deserve a closer look. This gives you a useful starting point when something does not look right.
Bundle recommendations turn your performance data into possible next steps. They can highlight areas that may need attention based on what is happening with your bundles. You can then use those recommendations alongside your own store data to decide what to test.
The most useful way to look at analytics is to connect a performance issue with a possible cause. A low number on its own does not always tell you what is wrong. Compare related metrics, look at the specific bundle or funnel stage, and then test the most likely improvement.
Low bundle revenue can happen for several reasons. Your bundle may not be getting enough traffic, shoppers may be reaching it but not buying, or completed orders may be smaller than expected. Looking at sessions, orders, conversion rate, and AOV together helps you narrow down where the problem is.
Low bundle sessions mean fewer shoppers are reaching your bundle. Start by checking where the bundle appears across your store, such as your navigation, product pages, collection pages, or a dedicated bundle page. You can also use upsell placements while shoppers browse or add products to their cart.
External traffic can make a difference too. For example, an ad campaign may send shoppers directly to a bundle page, making paid traffic an important source of sessions. If sessions are low, compare your store placements, upsell placements, and traffic sources to find where the bundle could get more visibility.
Look at bundle sessions and conversion rate together. If sessions are low, shoppers may simply not be finding the bundle. If sessions are healthy but orders remain low, the problem is more likely to be the offer or the shopping experience.
Review the products included in the bundle, its price, discount, and placement. It is also worth checking whether the bundle is being shown to shoppers who are likely to care about those products. This helps you separate a traffic problem from a conversion problem.
A low bundle conversion rate means shoppers are reaching the bundle but not completing the purchase. Use the bundle funnel to see where the biggest drop-off happens, then focus your investigation on that stage. The problem could be the products, pricing, discount, shipping, or overall bundle experience.
For example, a product may be out of stock or the products offered together may not make much sense. The discount may not feel valuable enough, or shoppers may be surprised by shipping costs. If the bundle includes products that need more consideration, clickable product cards can also make it easier for shoppers to view product details before deciding.
Bundles are meant to encourage shoppers to purchase multiple products, so a low AOV is worth investigating. Start by comparing the bundle with your other offers and looking at the products included in it. Since AOV is also influenced by product prices, consider whether the bundle includes enough higher-value products to drive a larger order.
Also check the average number of products selected per bundle order. If shoppers regularly choose only one or two products, the bundle may not be giving them enough incentive to build a larger basket. Testing more complementary or higher-priced products, along with different discount thresholds, can help you find what encourages a bigger order.
A low bundle share of order value means the bundle makes up a smaller part of the final order. This is not necessarily a problem, since shoppers may intentionally buy the bundle alongside other products. However, if the goal is for the bundle to become a bigger part of the basket, it is worth looking at why shoppers are adding other products instead.
Start with the bundle's product selection and value. Compare its share of order value with other bundles to see whether some offers naturally account for more of the final basket. If shoppers consistently treat a particular bundle as an extra rather than the main purchase, its positioning or product mix may need another look.
Good products do not automatically make a good bundle. Some products work naturally together, while others may not give shoppers a clear reason to buy them as a set. Product combination performance can help you identify which pairings are actually generating orders and revenue.
Compare stronger combinations with weaker ones and look for patterns. If certain products repeatedly appear in successful combinations, consider building more offers around them. For combinations that struggle, check whether the products complement each other, whether the price makes sense, and whether the bundle solves a clear customer need.
A low average number of products selected can keep bundle AOV lower than expected. Start by checking whether the available products are relevant enough for shoppers to want more than one or two items. Your discount structure can also influence whether adding another product feels worthwhile.
Compare product selection across different bundles and discount levels. If shoppers select more products when a certain threshold or offer is available, that gives you a useful pattern to test. The goal is not simply to increase the number of products, but to make each additional product feel useful.
The point where shoppers leave the funnel can tell you a lot about what may be going wrong. If the biggest drop happens between sessions and add-to-cart, look at the product mix, price, discount, and overall appeal of the bundle. Shoppers may not see enough value to continue.
If shoppers add the bundle to their cart but do not reach checkout, look for issues such as unexpected costs, shipping concerns, or a confusing bundle experience. If they reach checkout but do not complete the purchase, check payment, shipping, and product availability. Focusing on one stage at a time makes the problem easier to investigate.
Where you place a bundle can affect how shoppers discover and interact with it. With Easy Bundle Builder’s placement performance analytics, you can now compare individual upsell surfaces and see how shoppers move from seeing an offer to opening the builder, adding a bundle to their cart, and placing an order.
Look at impressions, CTR, open rate, add-to-cart rate, orders, and revenue for each surface. If an Upsell Offer gets plenty of impressions but few clicks, you may need to improve its placement or messaging. If an Upsell Widget gets strong engagement but low add-to-cart activity, the issue may be with the bundle itself, its products, pricing, or discount.
If one bundle type is underperforming, compare its revenue, orders, AOV, sessions, and conversion rate with other bundle types. This can help you work out whether the format itself is the issue or whether the problem is with a particular offer. You may also find that certain formats work better for specific products.
Use these comparisons when deciding which bundle types to promote or test. If one format consistently performs better, you can build more offers around it. For weaker formats, review the product mix, discount, placement, and customer experience before deciding what to change.
A low repeat bundle purchase rate means fewer customers are coming back for another bundle. Start by asking whether the products are something customers naturally need to buy again. A bundle made up of durable products will have a very different repeat purchase pattern from one made up of products customers regularly use up.
For products that customers replenish often, subscriptions may be worth considering. A subscribe option makes repeat purchases easier and saves customers from having to place every order manually. It can be particularly useful for consumable or frequently repurchased products.
Compare discount levels with orders, revenue, AOV, and conversion rate to see which offers perform best. There is no single discount percentage that works for every store, so your own data is a better starting point. Look for the point where a discount encourages more purchases without unnecessarily eating into your margins.
You can also compare similar bundles with different discount structures. If a deeper discount produces only a small increase in orders, the extra margin loss may not be worth it. This helps you find a discount that works for both shoppers and your store.
Add-ons are optional extras that shoppers can choose within a bundle. If an add-on has a low selection rate, check whether it is relevant to the main products, priced reasonably, and easy to understand. Shoppers are less likely to choose an extra if its value is not immediately clear.
Keep add-on performance separate from the performance of the main bundle. Add-on data tells you which optional products shoppers want, while individual bundle performance tells you how the overall offer is doing. This makes it easier to figure out whether the problem is with the bundle itself or one of its extras.
A change in bundle revenue does not always tell you what caused it. Compare revenue with sessions, orders, AOV, and conversion rate over time to see which metric changed first. Looking at these numbers together gives you a better explanation than revenue alone.
For example, revenue may increase because more shoppers are visiting the bundle, or because existing traffic is producing larger orders. If sessions stay steady while conversion falls, the issue may be with the offer or shopping experience. Use the trend to decide what deserves a closer look.
Comparing the current period with the previous one helps you spot changes that may be easy to miss in a single report. Look at revenue, orders, sessions, AOV, and conversion together rather than focusing on just one number. You can also compare individual bundles to see which ones are responsible for the change.
For example, imagine a bundle generated 500 sessions, a 2% conversion rate, and a $40 AOV last month. If it gets the same 500 sessions but conversion falls to 1%, traffic is probably not the issue. You can then focus on the offer, products, pricing, or shopping experience instead.
There is no single conversion rate, AOV, or discount level that defines a successful bundle for every Shopify store. Product category, price point, customer intent, traffic source, and purchase frequency can all affect performance. Your own store data is usually a more useful benchmark.
Start by comparing a bundle with your overall store performance, previous periods, and similar bundles. This gives you a more relevant baseline for deciding whether a bundle is performing well or needs attention. Over time, these comparisons can also help you establish your own performance benchmarks.
.svg)
.webp)

Rating

4.9
(
362
)
Easy Bundles is one of the best Shopify apps for cross-selling. The app enables your online store to build different types of product bundles that can be promoted to online shoppers in lieu of custom savings, discounts and offers. The bundles encourage the shopper to explore other items that can be bought with the product of their interest, enabling the business to sell more during the session - a cross-sell strategy that is proven to work across industries!
This Shopify product bundles app seamlessly integrates with your store UI, giving you the ability to promote the product bundles more naturally to your store visitors.
Features

Bundle Builder: Customizable layouts for unique bundle and box builder
Gifting bundles: Add personal touch with greeting cards, gift boxes, and videos.
Upsell & Cross-sell : Boosts sales via bundle and gift box creation.
Build your own bundles allows customers to discover new products and collections
Customizable UI for bundles: Integrated with your store for consistent branding.
Pricing
Free to install
Paid plans start at $9 per month


.avif)